Engineering Analysis:
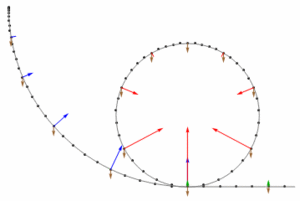
The arrows on the first picture below below show the forces. Please note that friction is not included.
Color code: Brown is the force of gravity
Blue is the normal
force going into the loop
Red is the normal
force within the loop
Green is the normal
force leaving the loop
Dots occur every
0.10 of a second.
This model is set
up so that the car has the minimum speed to make it through the top of the
loop, hence the only arrow at the top is the force of gravity.
All of the energy necessary comes from the PE at the top of the hill. Using the image above or the GIF below, determine the minimum ratio between the hill height and radius of the loop necessary for completion of the loop. Be sure to include the force of friction for your roller coaster material.
Safety Analysis:
A human being can
only safely handle 5 g’s of acceleration without passing out.
Using the model above, ensure that your passengers will safely make in
through the loop without loosing consciousness.
No comments:
Post a Comment